NEWS: Coming off Ohio’s last-place ranking in 2013, we have 3 predictions for this year’s national beaches report.
Posted by Jared Shepherd
- 4512 Views
- June 24th, 2014
- in Miscellaneous
- No Comments
Last year, a national report ranked Lake Erie beaches last in water quality. Where will they finish this summer? We could find out this week.
Cleveland’s lakefront has made a significant step forward since Cleveland Metroparks assumed control of its beaches last year. But challenges to its recreational water quality remain, and that could mean low rankings again when the Natural Resources Defense Council releases its 2014 Testing the Waters beach report.
We’ll see what the numbers say when the report is made official, but we can already make three predictions. And we can also put the predictions into perspective.
- LINK: 30 out of 30: Ohio beaches rank last again in NRDC’s 2014 report (Posted June 25, 2014)
[Download the complete press release]
1. The problems that led to a last-place ranking last year still exist.
The NRDC’s annual “Testing the Waters” report considers how many times a beach’s water quality is sampled during the beach season and how often the samples exceed limits for E. coli, an organism that indicates the presence of bacteria pollution. Lake Erie beaches in Ohio have fared poorly in recent years.
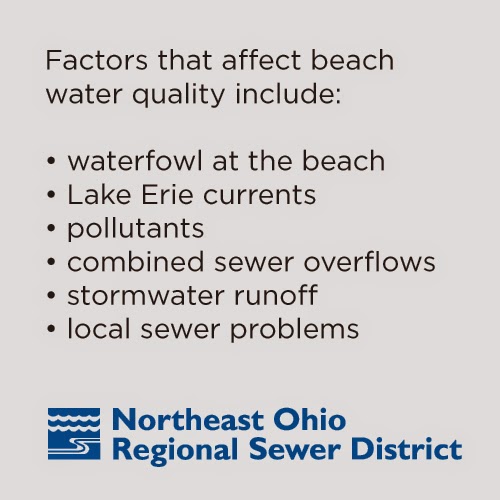
FACTORS: Many variables impact water quality, including the presence of waterfowl at the beach, the influence of Lake Erie currents, the fate of pollutants such as raw sewage discharged into local water bodies, as well as stormwater runoff, which can carry motor oil, garbage, bacteria, and other pollutants into local water bodies.
Additionally, there are problems with some of the local sewer infrastructure, like sanitary pipes inadvertently connected to storm sewers. This causes illicit discharges where sanitary water makes its way through a stormwater pipe and then is directly discharged into a local water body.
These factors are why bacteria counts and water-quality alerts posted are most common in the 48-hour window following heavy rain. More flow carries more pollutants into our recreational waters. Many other older cities like Cleveland face the same challenges.
2. The more you look, the more you find.
We don’t shy away from the challenges affecting our beaches. We monitor three beaches—Edgewater, Villa Angela, and Euclid—daily between May and September, while many other beaches in Ohio are sampled only up to four times a week. In some cities across the country, beaches are monitored just weekly.
That matters. In the words of our Director of Watershed Programs Frank Greenland in a press release today, “The more you look, the more you find.” The more samples we collect, the more high-bacteria-level results we’ll find. Conversely, we find more good water-quality results, as well. The data is what’s important: Daily sampling and daily Nowcast water-quality predictions allows us to give beach visitors a real-time look at the water they enjoy in order to keep them safe.
[Download the complete press release]3. We will already be making many of the solutions that will be recommended a reality.
Things are getting better. Guests to the lakefront this summer are already seeing bigger crowds and Cleveland Metroparks beach events.
But the annual report consistently recommends actions that can help make a difference. If they continue that trend, it will be apparent that we are doing just that.
Making progress: Our partnership with Cleveland Metroparks is helping keep our beach sand cleaner, but combined sewer overflow pollution and runoff are still factors raising bacteria levels after storms.
Project Clean Lake, a 25-year program to reduce combined sewer overflows, is less than five years in the making, but key projects deep under Cleveland will pay off, reducing the volume of pollution entering Lake Erie by billions of gallons every year. And while small victories may be seen today, large-scale improvements take time.
Can consistency affect clarity? Data can show progress, but what data does NRDC use in its beach report? The report bases beach water quality on each state’s E. coli level limits. But this year, NRDC is likely to use a more stringent national US Environmental Protection Agency limit that took effect in 2013. That could affect our ranking, but it’s important to note that the metrics are different, and that makes a direct comparison to last year’s report more difficult.
LOOKING AHEAD: Can a regional stormwater management program make beach water safer?
“Project Clean Lake is a great start, but it will not address all of the bacteria issues facing our beaches,” Greenland said.
“We have to control stormwater regionally, but unfortunately, the Sewer District’s Regional Stormwater Management Program is tied up in litigation. We have to manage illicit discharges on the local level, and the Sewer District has ramped up its efforts to identify and address those discharges.”
Personal responsibility can limit local beach pollution, but all of these solutions must be considered collectively, he said. “Otherwise, if we do not address these other pollution contributors, we’ll continue to see our beaches ranked at the bottom of NRDC’s list for years to come.”
Your health and safety
We and our beach partners are committed to guests’ health and safety. We will continue to report our findings and post beach conditions to keep beachgoers safe and informed.


