PIC: If only every Powerpoint graph was as awesome as the one 5th-grader My’a made us
Posted by Jared Shepherd
- 4722 Views
- December 16th, 2013
- in Miscellaneous
- No Comments
We love hearing we’ve made an impact on a child’s life.
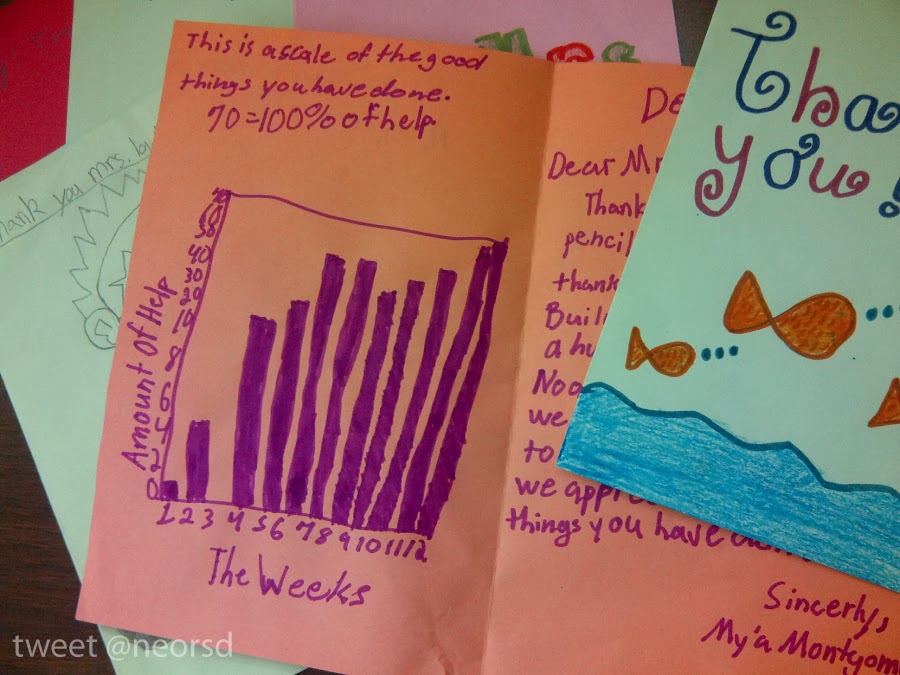
Even more, we love seeing that impact represented in a fifth-grader’s drawn-by-hand-in-marker graph that proves a staggering 9,900% increase! In just 12 weeks!
Can’t argue with statistics. It says right there: “amount of good things” the Sewer District has done.
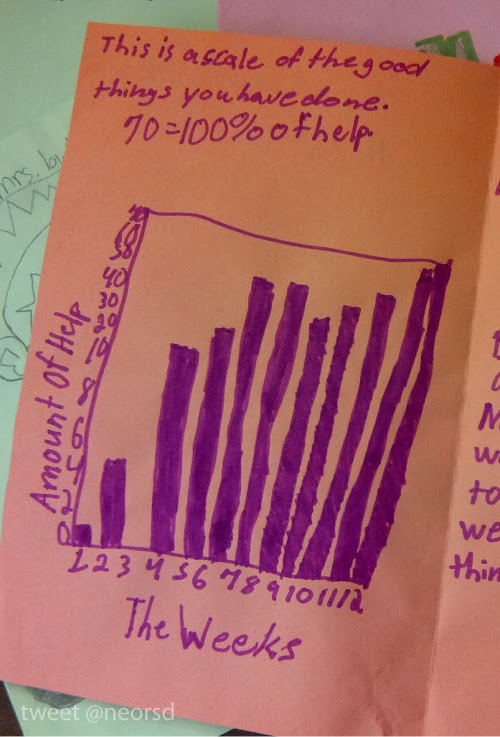
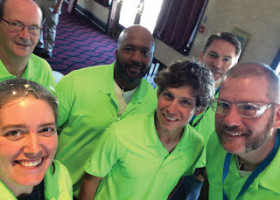
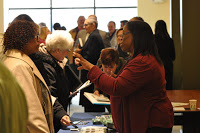
Bam. We’re not exactly sure how statistically accurate My’a Montgomery’s calculations are, but her card was one of dozens we received from Mr. Candel’s fifth-grade class about the water-cycle educational materials our own Ramona Lowery offered Woodbury Elementary in Shaker Heights.
Thanks again, My’a. We’ll be sure to include your stats in our 2013 performance evaluation, and when we get our 2014 budget .ppt together, we’re calling you.
If you’d like to request a guest speaker, send us a request.